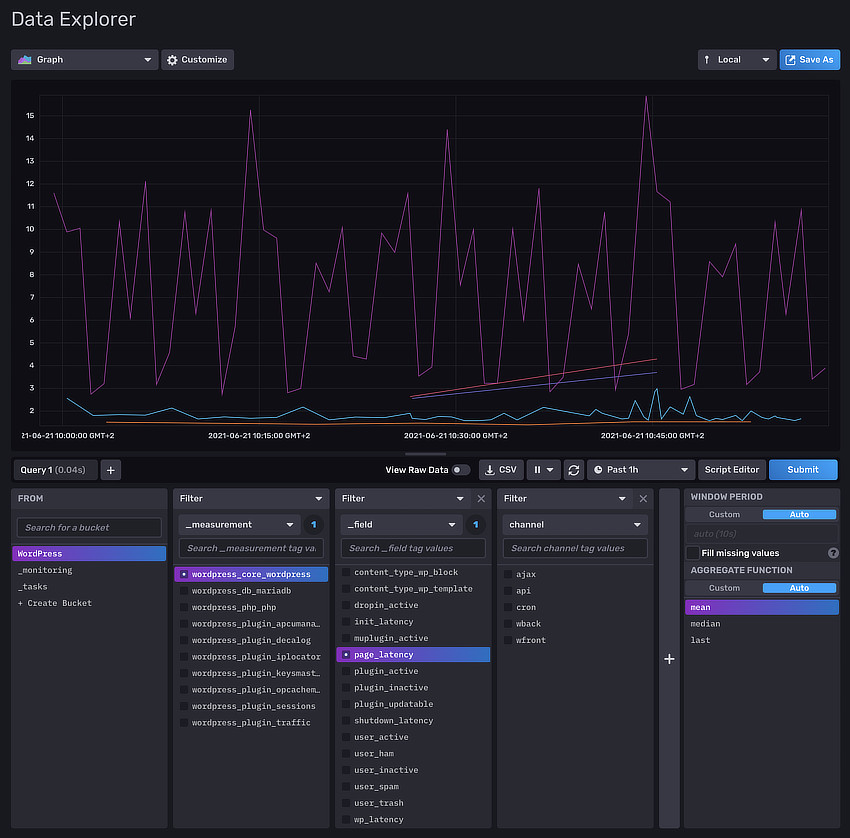
DecaLog have the ability to collate WordPress metrics.
These metrics can be published by the WordPress site itself as a polling REST endpoints or sent to specialized services or databases.
Note the metrics model used by DecaLog is a subset of the Prometheus standard.
Anatomy of a metric
A metric is composed of:
- A name, that uniquely identifies it.
- A type, which describe the way value(s) should be visualized. It can be a counter, a gauge or an histogram.
- A definition, which specifies what the metric is about and the unit in which it is expressed.
- A numerical value (an
intor afloat), which is the actual value of the metric at the time it is collected. - Some labels, that are automatically filled by DecaLog and represent the context in which metric is collated.
Metrics' profiles
A metric belongs to a profile. DecaLog uses two profiles: "production" and "development". As their names may suggest, the "production" profile may be used for permanent observability whereas the "development" profile is only really useful during the debugging phases. However, it is possible - and common practice - to use a "development" profile on a production platform.
Conventions
To be fully usable in all metrics rendering systems, a metric respects some rules and adheres to some standards:
Names
A metric name may only contain ASCII letters, digits and underscores. It must match the regex [a-zA-Z_][a-zA-Z0-9_]*.
It is a common best practice to not use plural forms in naming conventions and to use underscores to separate words.
Types
Each available type is used to represent and allow visualization of metrics that are intrinsically different.
A counter is a cumulative metric that represents a single monotonically increasing counter whose value can only increase all along the request. For example, it is used to represent the number of API calls, tasks completed, or number of encountered errors.
A gauge is a metric that represents a single numerical value that can arbitrarily go up and down all along the request. For example, it is used to represent memory usage or latencies average.
A histogram is a metric that samples observations (usually things like request durations or size breakdowns) and counts them in configurable buckets. It also provides a sum of all observed values.
To discover how DecaLog uses metrics types, you can get an eye on the "Metrics" tab of DecaLog settings.
Definitions
A definition may contain any character as long as it is properly escaped. A definition is always in english. It is a best practise, for definition settings, to follow the full description of the metric in plain text by a space and the unit (in singular form) between square brackets.
The units must be, to the extent possible, the base unit. It is a best practise too to avoid prefixes (K, M, G, etc.). It is therefore quite common to use units such as [byte], [second], [percent] or [count] for example.
Typical metrics sent by DecaLog and visualized in InfluxDB 2
